In the ViSit Anywhere 16.3 release we are introducing a number of new features to help users better exploit the available GPS data. These new features include:
- Access to the GPS noise statistics information,
- The ability to monitor the time since the last DGPS update, and
- A new GPS monitor view to help understand the NMEA stream.
GPS Noise Statistics
In this version of ViSit Anywhere, we are capturing the GPS noise statistics for the NMEA GST sentence. Note, that these are noise statistics and should not be interpreted as absolute errors, but rather the uncertainty in the measures that arise from random noise in the GPS signals. For the sake of this discussion, we will suppose that this noise follows a statistical normal (Gaussian) distribution. This will allow us to come away with a notion of how noise might affect our theoretically optimal measure. Note that we are presenting noise statistics from the GST NMEA sentence and make them available to ViSit Anywhere without further interpretation or manipulation. The noise statistics available in the GST sentence include:
- The standard deviation in longitude, latitude and altitude,
- The root mean square error of the position (Total RMS) which is square root of the sum of the squares of the positional (longitude and latitude) errors, and
- an error (standard deviation) ellipse defined by the length of the major and minor axis with the rotation from north.
If we assume that there is a normal noise distribution, 1 standard deviation (the error presented in the GST sentence) will contain the real value with about a 68% probability, 2 standard deviations will contain the value with 95% probability and 3 standard deviations will contain the value with 99.7% probability.
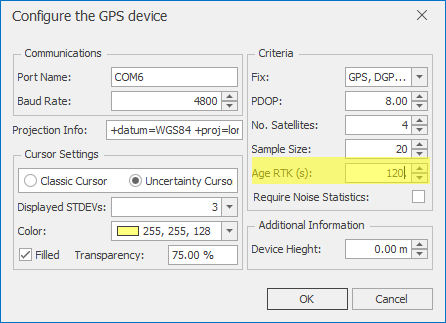
It is possible to configure how the noise statistics affect the ViSit Anywhere GPS sample with the GPS configuration dialog (shown below).
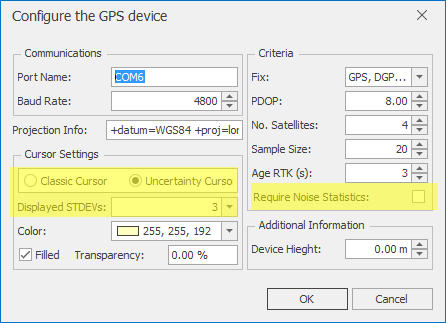
Note the three highlighted zones. First, in the Cursor Settings, we can select to show either the classic cursor or an Uncertainty Cursor. The uncertainty cursor displays the error ellipse around the zone of the sampled GPS location. See the screenshots below for an example. The Displayed STDEV's control allows the user to select the number of standard deviations that will be present in the user interface - 1 (68%), 2 (95%) or 3 (99.7%). As of ViSit Anywhere 21.1 this field has been renamed 'Confidence Interval' to reflect the underlying mathematical notion. Finally, in the Criteria section we can specify Require Noise Statistics. This means that a GPS sample will be valid only if there is associated GST noise statistics..
We can see the the effects of the noise statistics in the ViSit Anywhere user interface.
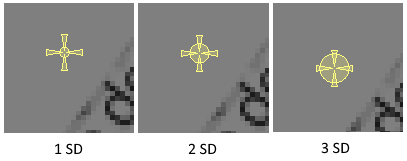
The image above show a simulated uncertainty cursor. Note, the size of the zone of uncertainty increases as we display more standard deviations. We can also see the numerical uncertainty values in the user interface by displaying the positional information in meters (the noise statistics are presented in meters rather that degrees in the GST sentence).
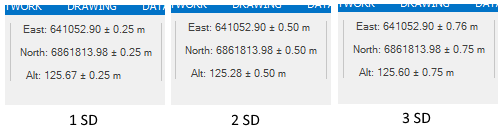
Again, we can see the effect of displaying more or fewer standard deviations in the (simulated) GPS positional data.
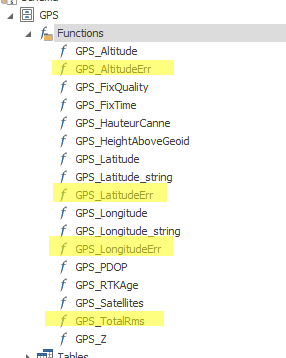
Finally, we have provided access to several new GPS related functions (available in the shared ViSit Anywhere GPS project). These functions can be used to populate property columns when sampling GPS locations. They correspond to the positional standard deviations and the Total RMS.
Time Since Last DGPS Update
If you are sampling using a DGPS (differential GPS), it is important that the GPS receiver accesses the DGPS service relatively often. Otherwise the user might think that he is sampling higher quality DGPS data rather than just normal GPS data. It is recommended that there be a DGPS refresh at least every 2 minutes (if you are using a DGPS service). In order to enforce this logic, ViSit Anywhere provides a new item in the Sample Criteria section of the GPS configuration dialog.
Here we are specifying the attribute Age RTK (s) as the time since we last accessed our RTK DGPS service (in seconds). If a sample can not meet the criteria, the value displayed in the RTK Age user interface field will be shown in red (see screenshot below).
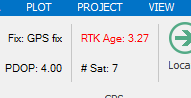
Note, that I am using a GPS simulator that emits RTK Age at 3 seconds (with noise), thus the RTK age is set at 3 seconds in this simulated example.
Note, that the value displayed in ViSit Anywhere is a field (Time since last DGPS update) in the GGA sentence in the standard NMEA stream. If a differential GPS service is not being used, this field will be empty. We present the value of the field without modification or interpretation.
The NMEA Monitor
Sometimes it is important to verify the raw data that is being received by the GPS device. This can often be difficult because the data arrives at a relatively high rate and the streams are hard to interpret visually. In this release of ViSit Anywhere, we provide a new NMEA monitor view that attempts to show the stream of GPS data arriving, while presenting a semi-interpreted view of the data to aid the interpretation.
The NMEA monitor can be opened using the button at GPS >> Monitor in the ViSit Anywhere user interface.
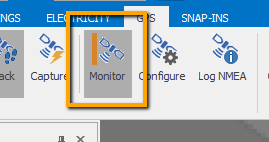
Toggling this button will open (and close) the NMEA monitor view.
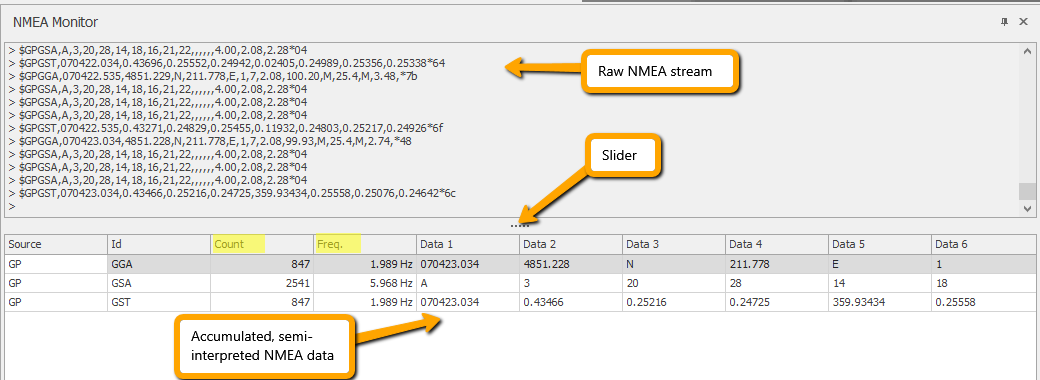
The NMEA monitor contains two sections with a slider between them. The user can increase the size of either section depending on exactly what he is looking for. The top section of the monitor contains the raw NMEA stream. For performance reasons, NMEA data is cached by the monitor so that the user interface updates only once per second or so. If the user is interested in the raw NMEA stream it is easy to capture data by copy and paste from this section. Note, only the last 250 lines will be buffered in the raw NMEA data section (for performance reasons).
The bottom section of the NMEA monitor displays a grid of semi-parsed NMEA information. In this section one grid line is displayed for each unique Source and Id pair. That is, if you are receiving both GP and GN data (for example), you may have a row both for the $GPGGA sentences received and the $GNGGA sentences. Note also that I am using simulated data in this screenshot and the simulator I am using only emits $GPGGA, $GPGSA and $GPGST data. When using a real GPS receiver, you would see all the emitted NMEA sentences, not only GGA, GSA and GST.
The Count and Freq. columns presented in the grid are interpreted rows. The Count is number of sentences received since the monitor was opened and the Freq. is the frequency for the particular sentence. The Data columns present the raw data. More columns are available (depending on the type of NMEA sentence) and can be seen by adding columns with the standard grid column picker control. It is relatively easy to verify the GPS information with a NMEA reference (such as the one found here), For example, Data 1 in the GGA sentence is the time of the sample (07:04:23.034) and Data 2 is the latitude (48° 51' 22.8''). The values in the Data columns represent those for the last sentence (of the indicated type) received.
Getting Started
Once ViSit Anywhere 16.3 has been installed on your system, it is easy to get started using the new GPS Snap-In features. Simply, click on the button at Project >> Default Ribbon Configuration (or access the item from the Help menu). Next, reopen your project and the ViSit Anywhere ribbon control will be updated.